Monday 31 October 2022

How Often Should You Blog? We Found A Blogging Frequency That Works

Graphic that says, "How often should you blog? We found a blogging frequency that works."

Do you find yourself often pondering blog-related questions, such as how many blogs per month for SEO? You’re not alone. There is no golden rule, but there are set practices to find the best fit for you, and we can illustrate how.

Blogging frequency is a common struggle for new bloggers and experienced bloggers alike. With so many factors to consider, including search engine optimization and brand awareness, it’s certainly an important thing to have planned out.

In this post, we’ll uncover the blogging frequency we found that works for one specific industry. We’ll show you how we drew this conclusion and how you can do the same for yours.

Why Is Blogging Frequency Important?

Blogging frequency is how often you publish blog posts on a weekly or monthly basis.

There are a number of benefits to finding your ideal blogging frequency.

First and foremost, blog posts allow you to rank for organic keywords. These are needed for driving organic traffic to your site.

A frequently updated blog also increases brand awareness. The more you post about your industry, the more aware of your web presence, your products, and your services your target audience becomes.

Blogging can help your business build trust in the community. Posting relevant content about your industry and regularly updating it will help convey trust and authority to your audience. They will be more likely to convert on your site versus a competitor that rarely updates their content or posts blogs.

For more practical reasons, a blog post frequency helps you to set a standard for yourself or your content writing team. Without a frequency in mind, you may constantly focus on writing blog posts at the expense of other activities. This extends to adjacent teams too, like social media and design, who would greatly benefit from a known frequency so they can prioritize their tasks.

So a blog post frequency gives you both an upper and lower limit, which means you can spend more time and money focusing on other aspects of your business.

Are You Blogging Too Often?

In addition to asking how often do you need to blog, it’s not uncommon to ask what happens when you blog too frequently? Or, is that even possible?

Perhaps you’re thinking the more, the better. As you’ll see in the analysis below, it’s not quite that simple.

You could post daily on your blog. Hourly, even. Will it be your best content, though? Remember that quality is better than quantity in almost all cases. By posting too frequently, you may be sacrificing the quality of your content which itself will have a negative impact on your brand.

What We Learned From Our Data about Blogging Frequency

For this analysis, we’re evaluating eight companies in the CBD industry. To find out how many blog posts they publish per month, we looked at their post sitemaps and calculated the average number of posts per month since January 2022.

We looked at a few metrics when measuring their success.

First, we looked at the overall keyword universe, meaning we analyzed the total number of keywords the blog ranks for on Search Engine Results Pages (SERPs). To drill down further, we also looked at the number of those keywords which ranked within the top 10 results, or on the first page. Finally, we compared the number of organic keywords each business ranked for in the top three results. These are the most coveted positions.

The greater your number of organic keywords, the farther your reach. While it’s not the only metric to consider when measuring success, it is a good indicator of such.

RoyalCBD.com: A High Post Frequency Example

RoyalCBD.com for ideal blog post frequency

With the highest post frequency on our list, RoyalCBD.com boasts an average of 18 blog posts per month. This seems to have paid off, with 24,351 organic keywords driving traffic to the website.

More important than organic traffic, however, is the quality of that traffic. RoyalCBD seems to boast high numbers there, too. The website has 5,603 keywords ranking in the top 10 and 2,920 keywords ranking in the top one through three positions on SERPs.

JoyOrganics.com

JoyOrganics.com for ideal blog post frequency.

The next on our list, JoyOrganics.com, also happens to be the site with the second-highest posting frequency that we analyzed. That is, 17 posts per month on average from January 2022 through June 2022.

This is likely a contributing factor for the rather high number of organic keywords – 17,103 to be exact – driving traffic to the site. Of those keywords, 1,679 rank in the top 10 and 511 rank within positions one through three on SERPs.

CBDfx.com: Is One Post Per Month Enough?

CBDfx.com for ideal blog post frequency.

On the opposite end of the spectrum, there is CBDfx.com, with a blogging frequency of about one post per month.

Before you think CBDfx.com is an anomaly, you should know they have refreshed 155 blog posts on their site in June 2022 alone. This means they optimized existing posts to meet current SEO standards. So while their posting frequency is low, the refreshed content is likely playing a large role in their organic keyword rankings.

CBDfx.com has 18,023 organic keywords with 2,576 ranking in the top 10 and 984 ranking within the top three positions on SERPs.

The takeaway here is that refreshed content can be just as important as new content for rankings.

HempFusion.com

HempFusion.com for ideal blog post frequency.

While we initially looked at post frequency from January 2022 through June 2022, there are some websites that have yet to post in 2022. This includes HempFusion.com. In those cases, we looked back at July 2021 through December 2021.

From July through December 2021, there was an average of seven blog posts per month. Despite not posting in 2022, this prior frequency seems to have provided some protection for HempFusion.com on SERPs. It currently has 2,827 organic keywords, with 391 ranking on the first page and 201 ranking in positions one through three.

MedterraCBD.com

MedterraCBD.com for ideal blog post frequency.

Here’s another site with no blog posts in 2022. From July through December 2021, though, MedterraCBD posted an average of five blog posts per month.

You might be thinking that surely MedterraCBD.com will have fewer organic keyword rankings than HempFusion.com. MedterraCBD.com actually has considerably more. To be specific, 7,435 organic keywords with 840 ranking in the top 10 and 486 ranking in the top three.

There are a few reasons for this. Foremost, MedterraCBD.com has ranked since the middle of 2017 while HempFusion.com only started ranking around January 2020. MedterraCBD.com has also seen higher average rankings overall, so it’s likely to see the effects of not posting less drastically.

JustCBDStore.com

JustCBDStore.com for ideal blog post frequency.

With 14 posts per month, surely JustCBDStore.com has a significant number of organic keywords.

Surprisingly, this site has only 8,680 organic keywords. Of those, 1,615 rank in the top 10, and 776 rank within the top three on SERPs. That’s close to the sites like HempFusion.com and MedterraCBD.com that didn’t post at all in 2022!

We know it’s not the posts per month responsible for that low of organic keywords. So the answer is likely in a factor we have not considered, such as the age of the website or social media presence.

Purekana.com: Moderate Number of Posts Per Month

Purekana.com for ideal blog post frequency.

Another on our list with a moderate number of posts per month, Purekana.com has a monthly blogging frequency of approximately 13.

Similar to JustCBDStore.com, Purekana.com has a small organic keyword profile with 7,126 organic keywords. Of these, 983 rank on the first page of SERPs, and 414 rank within the top three.

cbdMD.com

cbdMD.com for ideal blog post frequency.

Here’s another anomaly, though occurring in the opposite direction of what we saw above.

cbdMD.com posts an average of 13 blog posts per month. Despite this middle-of-the-road number of blog posts, it has the most organic keywords on our list with 37,784. This includes 5,924 keywords ranking in the top 10 and 2,154 keywords ranking within the top three.

But How Often Should I Blog?

To recap our findings, we analyzed eight CBD websites with the intention of pinpointing the optimal number of blog posts per month for the industry. Here is what we found:

A graphic showcasing blog posts per month, organic keywords, and backlinks for different websites.

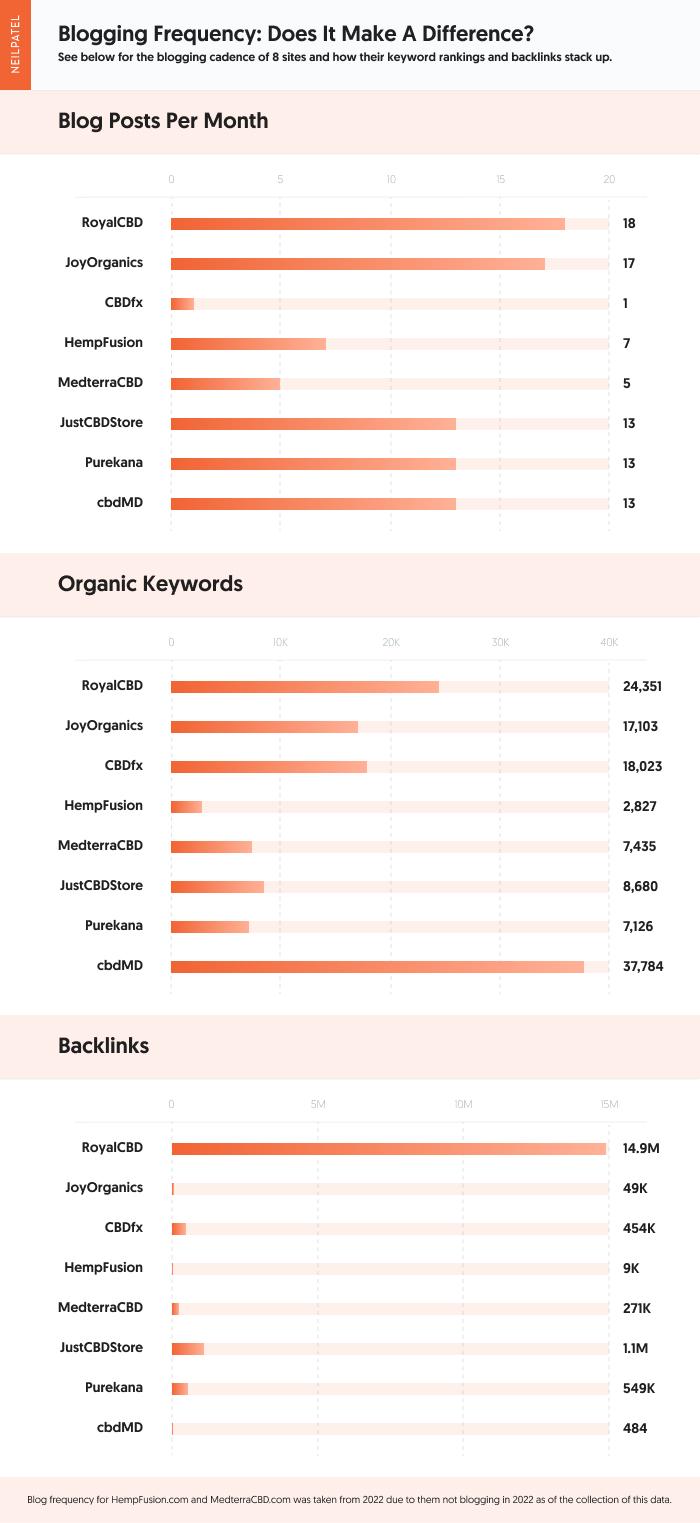
cbdMD.com has the largest number of organic keywords. When you take into account its modest domain authority and medium-sized backlink profile, it becomes clear that the number of blog posts is the driving factor for its success.

Why is this not the case for JustCBDStore.com and Purekana.com, both of which also post approximately 13 blog posts per month? There are a lot of other variables at play, such as target keywords, length of the average blog post, and social media presence.

What does this mean for you?

Our research shows that for this industry, 13 blog posts per month is a good balance between quantity and quality. These should be focused on well-researched topics with at least one or two target keywords. This should further be accompanied by ample support from your cross-functional teams. This means social media promotion of the posts and digital assets from your design team at the very least. 13 a month was a number that allowed the sites we mention above to strike that balance.

In addition, blog post refreshes should also have a place in your content writing strategy. There’s no magic number of refreshes to implement here. It’s more so about updating older posts that may not fit in with the most recent SEO recommendations. This also gives you an opportunity to improve your internal linking.

Finding the Ideal Blog Post Frequency for You

The blogging frequency we found to be ideal for the CBD industry may or may not be ideal for your industry. So how can you find the ideal blog post frequency for your industry and, even more important, your blog?

The best way to do so is with an analysis of a sample of blogs within your industry like we performed above. You can easily do this with access to XML sitemaps and an SEO analysis tool like Ahrefs or, of course, Ubersuggest.

What does this look like?

  1. Find ten to 15 competitors with blogs in your industry to evaluate.
  2. Locate the sitemap for each of these websites.
  3. Take note of how often each site posts within a designated time period. We recommend looking at the last six months if possible.
  4. With the average number of posts per month for each site, you can now use an SEO analysis tool for a fuller understanding of that site’s SEO profile. Look specifically at the number of organic keywords and the number of keywords ranking within the top ten.
  5. With this information combined, you can determine which post frequency correlates to the highest number of organic keywords in your industry.

While organic keyword profile isn’t the only indicator of a solid posting frequency, it’s one that seems to correlate highly. So do take other factors into consideration if something stands out, but don’t overcomplicate it.

FAQs

Here are the answers to frequently asked questions on the subject of blogging frequency.

How many blogs should you post a week?

The answer is not so cut and dry as we’ve highlighted above. Once you have found your ideal blog post frequency for the month, it’s best to break it down into weekly goals.

How often do most bloggers post?

In our data, we saw post frequencies anywhere from once a month to almost 20. The answer is going to vary based on the client’s industry as well as the capacity of their content team, though it’s important not to compromise quality for cadence.

Does it hurt my content marketing to blog more or less than my competitors?

While competitor research can provide a good idea for the number of blog posts to write each month, it’s not the be-all-end-all. You should also consider how many quality posts you can write and whether you actually have something useful to say.

How can I find creative blog ideas?

There are plenty of ways to find creative blog ideas for your blog. You can research your competitors using Ubersuggest, find keyword ideas in Google Search Console, and or even use a blog idea generator.

What makes a quality blog post?

This could be an article topic all its own, as there is a lot that goes into quality blog writing. A few elements of a quality blog post include a compelling headline, a narrow focus, and a unique brand voice.

Conclusion

When it comes to determining the ideal blogging frequency for your website, there is no magic number. There are many factors that play into that decision.

So how can you determine the best frequency for your blog?

The key is to look at other blogs in your industry and compare their posting frequency to their organic keyword profile. You’re looking for a strong organic keyword profile – the highest number of relevant page one keywords within the industry – for a clue as to how many posts per month are ideal for your blog.
Remember, though, that quality is just as important (if not more so) as quantity. So maintain a frequency that nears the ideal frequency for your industry but that still allows you to maintain a high content quality.


from Neil Patel https://ift.tt/sqPohde
via IFTTT

2023 is Going to be Bad for Marketing, But There’s Hope

If you just look at the data, it paints a very grim future for marketing… at least in the short run.

For example, we may go into a global recession as the Federal Reserve continually increases interest rates and it has caused businesses to cut back.

Especially on the advertising front.

Just look at the recent earnings calls from advertising giants. Alphabet only slightly increased advertising revenue in total, although YouTube decreased by roughly 2%.

They are also seeing massive pullbacks in some large industries. For example, there has been a pullback in crypto, mortgage, insurance, and even gaming ad spend.

And it’s even worse for Meta. Their average revenue per user has dropped to $9.41 versus $9.83.

They also stated that their Q4 revenue, which mainly comes from advertising, is lower than most predicted with a range of $30 to $32.5 billion.

Snap had a similar story to the other online ad platforms, while Pinterest grew 8% a year which was more than analysts expected.

Nonetheless, no matter what platform you look at, it’s safe to say that the advertising industry is seeing a slowdown.

Now let’s dive into the obvious bad news, and then we will get into the silver lining and how you should adapt. Because there is hope and you can still do well in this market.

Bad news

The marketing industry is going in a downward direction fast. I’m no economist, but most of it is related to external factors none of us can control… such as rising interest rates, supply chain issues, increases in oil and energy prices, issues with real estate across the world, and worst of all, war.

And when you have the S&P 500 down 18.67% it means companies have lost a lot of money… and I mean a lot.

Just think of it this way, the companies in the S&P 500 have a market capitalization of 30.12 trillion dollars.

In December of 2021, the S&P 500 had a market capitalization of 40.36 trillion dollars. That’s roughly a 10 trillion dollar loss.

To put it in perspective, if Apple, Amazon, Google, Facebook, and Microsoft didn’t exist that would only be 6.8 trillion dollars (based on today’s stock price).

When the market goes down, the value of which companies are worth goes down, which means companies cut back on spending. Marketing happens to be the first thing that gets cut in a bad economy.

And when the value of companies goes down, a lot of people’s net worth goes down. Just in America alone, 43% of the population owns stocks.

So, when people’s net worth goes down, eventually they start spending less. It’s already started to slow too… when you look at data from the first half of this year (inflation-adjusted) spending increased by 1.5% compared to 12% last year.

But what about marketing?

Here’s what’s interesting…

Because our agency, NP Digital, works with companies of all sizes we see data from both small and medium businesses as well as enterprises.

Plus we have offices and employees throughout the world such as in Canada, Brazil, Germany, India, Australia, etc… because we work with companies in multiple regions and help them with their global and local marketing campaigns.

That in combination with working closely with some of the big advertising platforms and having tools like Ubersuggest that tracks millions of domains we really see a lot of data and trends.

Here are the 3 main trends we are seeing (keep in mind the data below is from what we can see and track, as we don’t have data on the whole web or even a large fraction of it):

Trend #1: Ad costs are decreasing

Overall, the global costs for ads have been going down by 4%. Some industries like real estate have gone down much more, but with other industries like B2B SaaS, we haven’t seen much of a change with our clients as they optimize for lifetime value.

A lot of this is because businesses are cutting back on their spending in addition to many sectors such as real estate not having the same demand that they had a year ago.

Trend #2: Buyers aren’t converting at the same rate

We aren’t seeing conversion rates as high as they used to be. We’ve seen a drop of 7.13%.

Keep in mind that different websites have different conversion goals. Such as one website may focus on leads while another may focus on a signup or another may focus on a purchase.

Conversion rates are also affected by many other factors such as companies increasing prices due to inflation costs, shipping costs, and supply chain delays.

Or conversion rates being lower because some people aren’t spending as much because they may have lost their job.

Trend #3: Companies are fearful of the unknown

We are seeing some companies pulling back on their total marketing budget because they are afraid of what lies ahead.

But we are also seeing companies shift their budget to digital marketing because it is easier to track than let’s say traditional TV or radio advertising.

Now we don’t manage traditional budgets for our clients, but we handle the digital side. In a good or a bad economy, companies tend to spend on digital marketing (things like SEO, paid ads, email marketing, social media, etc) as long as it is profitable.

The silver lining in marketing

As I mentioned earlier, we see a lot of data.

There’s a pattern that we have seen with the companies that have been growing this year (the ones we work with at least).

And to be clear, when I say growing, I mean companies that are generating more revenue and profit.

These companies are also taking advantage of the current economic climate to double down on their whole business, not just marketing, to gain more market share.

So, what are these growing companies doing in this economy?

  • Conversion optimization – 83% of them have doubled down on conversion rate optimization. If you can get more of your visitors to convert into customers through copy, images, or products you can generate more sales. A great example of this is Legion which will grow around 40% this year mainly due to conversion rate optimization, while a lot of their D2C competitors are flat or declining.
  • Influencer marketing – 49% have either doubled down on their influencer marketing budgets or started influencer marketing. Rates for influencer marketing have gone down. They can convert well too if you focus on micro-influencers that have your target audience. They tend to be both cheaper and generate more revenue. You just need thousands of them to really build scale (not hundreds).
  • SEO – SEO is a long-term play, but it provides a massive ROI. Only 2% of the companies we work with that have grown this year have slowed down on their SEO efforts. 98% of them continued their current budgets or increased them when it comes to SEO.
  • Global expansion – an easy way to generate more revenue is to add new regions to sell your products and services in. 19% of the winning companies we work with have expanded into new regions. This creates more revenue generation opportunities, and you’ll find that marketing is much cheaper in most regions compared to the U.S. or U.K. Sure you won’t generate as much revenue, but the ROI tends to be higher from what we are seeing.
  • Email marketing – it’s rare that we work with a company that isn’t collecting emails or already doing email marketing. But what’s funny is companies assume that if you just send out promotional emails every once in a while, or a few educational ones… that’s considered email marketing. Sadly there is much more to it. For example, segmenting your lists and sending different campaigns to different people. Or optimizing your open and click rates. 77% of the companies we work with that grew this year doubled down on email marketing and fine-tuned their campaigns.
  • Omnichannel marketing – there is multi-channel marketing and there is omnichannel marketing. 100% of the companies we worked with that grew focused on omnichannel marketing and continually expanded. What I mean by this is when a company uses omnichannel marketing, the channels work together and they are also using learnings from each channel to maximize others. Versus multi-channel marketing where each channel just sits in a silo. TikTok has been massive for ecommerce… and channels like Snap, Pinterest, Reddit, Bing or even Quora that people don’t really talk about have been effective too.

Conclusion

Just because the economy isn’t where you want it to be, it doesn’t mean you can’t grow.

And if you really have headwinds ahead of you such as the mortgage industry, you can still make a lot of changes that will put the company in a much better place when the economy starts to recover.

In other words, start thinking outside the box. Don’t focus all of your energy on the news… sure it’s smart for you to stay up to date with what is happening, but the majority of your time should be spent on solutions and new ways to grow.

If you want my team to help with this, just check out my ad agency NP Digital.

So, what are you seeing in this economy?


from Neil Patel https://ift.tt/VSCXyeh
via IFTTT

Sunday 30 October 2022

Brand Perception: What is it & How Do We Measure it

Graphic that says, "Brand perception: what is it & how do we measure it."

Wondering why perception is so important in marketing? This quote sums it up nicely: “Facts matter not at all. Perception is everything. It’s certainty.” – Stephen Colbert.

You see, it doesn’t matter how good your product/service is, the value it offers, or the quality you provide. If consumers don’t perceive your brand the way you want them to, your business will struggle with loyalty and getting new customers.

Today, I’m covering brand perception in detail. What is it, and why does it matter? How do you measure it? Keep reading to find out more.

What Is Brand Perception?

In marketing, brand perception is how consumers see and feel about a company or product. It’s how customers interpret and react to messages, experiences, and interactions with a brand.

Obvious things like marketing, word-of-mouth, and customer service contribute to your brand perception, and less obvious areas like colors can also influence how customers perceive you. (I’ve written an article if you want to know the best colors for online conversions).

Brand Perception vs. Brand Equity

While both concepts are essential to businesses, they serve different purposes. As you know, brand perception helps you understand how customers see your company; in contrast, brand equity allows you to quantify the value of your business. It consists of multiple factors, like:

  • Brand loyalty
  • Name recognition
  • Visibility

Essentially, brand equity is the difference between what a customer would pay for a generic product and what they would pay for the same product from a specific brand.

There are several ways to build equity in a brand. One is by offering high-quality products or services that customers can rely on. Another is positive customer experiences that leave people feeling good about the brand.

Creating an emotional connection with consumers can also help build equity, as people with a positive association with a brand are more likely to be loyal.

Why Do You Need Strong Brand Perception?

A brand isn’t merely a name or logo. It’s also the perception that consumers have of a company or product, and that idea can make or break a business.

Think about it – would you buy a product from a company you don’t trust? Or one whose values don’t align with your own?

Probably not.

That’s why brand perception is so important. It’s the difference between customers choosing your company over your competitors.

In addition, a strong brand perception:

  • Helps build trust with your audience. We mentioned earlier how important trust is, and how it makes people more likely to do business with you.
  • Lets you stand out from the competition. In a crowded marketplace, it’s important to have a unique and recognizable brand that people can easily identify and remember.
  • Can lead to higher profits. Customers pay more for products and services from brands they know and trust; when you have a loyal customer base, they keep coming back, leading to even higher long-term profits.

If consumers perceive your business positively, it can put it on the map, and if you’re already established, a good impression can grow your brand exponentially.

Let’s use Apple as an example.

Although it’s had its ups and downs, customers’ brand perception of Apple is largely positive. Additionally, it has a Net Promoter Score (NPS) of 72. The NPS measures customer experience and potential business growth by using a simple one-ten scale:

Apple's Net Promoter Score is an indicator of brand perception.

Why the love for Apple? Well, it:

All these factors give buyers confidence and, you’ve guessed it, give Apple a great brand perception.

On the other hand, what about Meta (formerly Facebook)? According to branding expert Rebecca Biestman, Facebook can’t repair its brand perception simply by changing its name.

Scandals like Cambridge Analytica significantly wounded the company’s reputation, and its user base is set to decline for the first time ever; although there are multiple factors behind Facebook’s falling user numbers, brand perception is among them.

Now that you see how consumers’ brand perception can influence your business’s fortunes, let’s discuss how you measure it.

How Do You Measure Brand Perception?

Fortunately, measuring brand perception is not as complicated as you may think. Below are some of the easiest ways to understand how buyers and prospects view you.

Customer Outreach

Email lists, online review platforms, and social media make reaching out to your customers easier than ever. Want to know what your buyers think of your product or service? Or how to make them better? Send them a survey and ask them what you could do to improve.

Brand Perception Surveys

If you’re a larger company with a decent budget, consider brand perception surveys or focus groups.

For more general answers on what your buyers value, you could ask them things like:

  • How important is it for you that a brand aligns with your personal values?
  • How much does a brand’s reputation affect your decision to purchase its products or services?
  • How much does customer service influence your perception of our brand?

These questions can give you a better idea of what customers look for in a business and provide valuable and actionable feedback. For instance, if you believe you provide great customer service but your customers believe you could be more responsive, you can introduce measures to improve response times.

Then you might ask them questions like this:

A brand perception survey.
  • Does our brand make you feel more confident or stylish? Explain why.
  • To what extent do you feel like you are a part of the brand’s community or “tribe”?
  • Would you recommend our brand to your friends or family?
  • Have you ever been disappointed by your experience with our brand? Why?
  • What emotions do you associate with our brand?
  • Describe our brand in three words.
  • What are your favorite products/services and why?

Of course, the type of questions you ask depends on what you want to achieve. Here are some tips for creating a brand perception survey:

1. Decide what you want to measure. Do you want to know how customers feel about your brand overall? Or are you looking for feedback on specific products or services? Determine what you want to learn from the survey to create suitable questions.

2. Keep the questions focused. Too many questions can overwhelm respondents and make it difficult to get useful data. Stick to around 10-15 questions that are relevant to your goals for the survey.

3. Make sure the questions are clear and easy to understand. Use simple language and avoid jargon.

4. Ask open-ended questions to get detailed answers rather than ‘yes’ or ‘no’ responses.

Use Social Media

Yes, you can spend your time looking through your Twitter feeds and relevant tags, but you may find automating the task with social listening tools more efficient.

Social listening tools can track and measure brand perception across social media channels. By analyzing online conversations, businesses can get insights into how customers perceive your brand, what customers are saying, and what areas need improvement.

Many different social listening tools are available, each with unique features and benefits. Some of the most popular include Hootsuite Insights, Brandwatch, and Talkwalker.

Social listening tools like Hootsuite Insights measure brand perception.

Brand Audits

A brand audit is a detailed analysis of how customers and other stakeholders perceive a company’s brand, allowing businesses to identify areas where the brand is strong and where it needs improvement.

An audit usually involves:

  • Conducting surveys and focus groups with customers and other stakeholders.
  • Analyzing media coverage, social media activity, and other data sources.

You can then use this information to create a detailed report to help you understand your brand’s strengths and weaknesses.

Brand audits can be important for businesses looking to improve their brand perception. By understanding how customers and others perceive the company, businesses can make changes to improve their image.

In addition, brand audits help you understand:

  • Consumer ratings of your brand and why your buyers/prospects view you that way.
  • How you compare with your top competitors.
  • How your customers would describe your brand; this helps you understand if your messaging is right.
  • Your brand trajectory or where your customers see your business going.

Finally, check online review sites to see what your buyers are saying about their experience and address any shortcomings you discover.

Best Practices For Improving Brand Perception

There are some best practices every business can introduce to enhance its brand reputation. Here are some of them.

First, start with the basics. Ensure you deliver high-quality products and services and always exceed/manage customer expectations.

Next, use effective marketing to improve brand perception by communicating the right message/image about your company to the right audience. You can do this by using customer avatars or buyer personas to understand your ideal customers and the type of content that most likely resonates with them.

Then, focus on the customer journey. Complete customer journey mapping to see the purchasing process from your customer’s perspective. Doing this helps ensure each interaction along the customer journey leaves a positive impression.

Use Social Media to Your Advantage

I’ve already discussed social listening, but responding to what your consumers say is every bit as vital. It doesn’t matter if a buyer’s experience is positive or negative; they’re only too happy to share their views on social media. While you can’t do much about this, you can at least ensure you’re fast to respond and offer your customer a positive outcome.

Giving swift responses and addressing issues is more likely to improve your brand perception and get you noticed by potential buyers.

Don’t Underdeliver

Does your product do what it says on the label? Making bold claims in your advertising that you can’t deliver is guaranteed to underwhelm and frustrate your customers.

However, don’t just focus on your product descriptions, features, and benefits. Check your images, too. For instance, does your imaging suggest your product comes with accessories when it doesn’t?

Take Feedback On Board

You’ll never perceive your product or service the same way as your customers. Your buyers and prospects can often give you insights and suggestions you’ve never even dreamed of.

Whether it comes from social media, surveys, reviews, or niche-related forums, understanding your customer’s pain points helps you develop and refine products/services to meet their needs.

Train Your Staff

Training your staff ensures they feel empowered to answer consumer/leads questions accurately. When your staff are knowledgeable, it inspires confidence among buyers and enhances your brand perception.

Examples of Brand Perception Success

Changing times and consumer demand often mean companies must reposition themselves if they want to influence customers’ views.

Let’s look at two examples of brand perception.

Zoom

At first glance, Zoom might look like an overnight success, but that’s not the case. Eric Yuan founded Zoom in 2011. It had a public launch in 2013, with a mission of ‘making video communications frictionless and secure’.

However, it wasn’t until 2020 that it became more mainstream. As its popularity soared, the brand perception changed. ‘Zoom fatigue’ became a thing. Some employees spending lengthy periods on the app complained of exhaustion from the extra cognitive demands of video conferencing, irritability, and muscle tension.

Then, later, Zoom’s growth started to flatline.

Zoom’s answer to this problem? It repositioned itself to change users’ brand perception.

It launched a ‘How the World Connects’ campaign and expanded away from video with the Zoom phone. Online, the company stressed its highly successful track record, highlighting how half a million businesses use Zoom, including:

  • 70 percent of the Fortune 100
  • Over half of the Fortune 500
  • 85 percent of the Forbes Cloud 100, the world’s top private cloud companies
A graphic that says, "70% of the Fortune 100 choose Zoom."

That’s before you get to the ton of top finance, healthcare, and educational facilities that use Zoom and how the app helps them. For example, Zoom provides secure communications for hybrid working and allows better collaboration between teams. It sounds like a real success story, doesn’t it? And perhaps one you want to be part of.

Chipotle

Here’s a great example of how marketing can change brand perception.

Think of Chipotle, and the first thing that comes to mind is fast food. However, the company wanted to win new customers for its ‘Lifestyle Bowls Range’ for those following vegetarian, vegan, and keto diets.

An image of a lifestyle bowl from Chipotle.

To achieve this, Chipotle needed to change its brand perception and reposition itself as a healthier alternative. By working with a marketing agency, Chipotle highlighted the use of its natural, fresh ingredients in its made-to-order takeaway meals.

The agency:

  • Divided potential consumers into different tribes like ‘Fitness Fanatics’ and ‘US Health & Nutrition’.
  • Used the insights gathered from the different tribes to reach these audiences with targeted traffic and awareness campaigns.
  • Applied geo-targeting to attract customers to new restaurants.

The results were impressive by anyone’s standards, leading to 10.7 million impressions and potentially 2.5 million new customers. In addition, click-through rates (CTRs) exceed standard benchmarks, averaging 1.24 percent.

This case study highlights the importance of:

  • Tailoring your message to your target audience and mindset segmentation.
  • Using bespoke segmentation analysis to create hyper-relevant and audience-centered campaigns instead of relying on generic advertising.
  • Analyzing your audience to discover new target markets and ensure your new brand voice stands out.

If you want to change your brand perception or move into new market sectors, taking these measures can supercharge the impact of your advertising campaigns.

FAQs

What is an Example of Brand Perception?

Apple has an excellent brand perception, built on having high-quality products that are easy to use. Its positive brand perception has helped Apple become one of the most successful companies in the world.

How Do You Create a Brand Perception?

Brand perception starts with knowing your audience and understanding what they want and need. From there, you can create messaging and visuals that resonate with them.

How Do You Measure Brand Perception?

You can measure brand perception through audits, surveys, social listening, and reading reviews.

What Factors Influence Brand Perception?

Numerous factors influence brand perception, like your marketing, word of mouth, customer service, and color scheme.

What Is The Importance of Brand Perception?

Brand perception is essential to your business. The better consumers perceive your products/service, the more loyal your customers are likely to be, and you can charge a premium for your products.

Why Is Perception Important in Marketing?

Perception is important in marketing because it helps you understand how customers see your brand. This understanding is valuable when deciding how to position your brand and what messages to communicate to your target audience.

What Is the Difference Between Brand Perception and Brand Equity?

Brand equity is the value of a brand based on customer perceptions and associations. Brand perception is how customers perceive a brand in the present moment.

Conclusion

Let’s return to my original point: perception is everything. It doesn’t matter if the image customers have of your business is accurate or not; it only matters what their perceptions are.

The truth is that companies sometimes perceive themselves differently than their customers or prospects, which can make it difficult to attract new buyers.

Poor brand perception can hamper growth, limit customer loyalty, and ultimately means you don’t reach your core audience.

However, businesses can make better decisions about their marketing efforts by understanding brand perception and how to measure it. Additionally, companies can identify trends and adjust accordingly by tracking brand perception over time.

What brand perception are you trying to craft for your business?


from Neil Patel https://ift.tt/ztjNDaY
via IFTTT

Saturday 29 October 2022

SEO Expert’s Guide to a GA4 Landing Page Report

With the sunsetting of Universal Analytics (UA) on the horizon in 2023, it’s more important than ever to learn how to create a Google Analytics 4 (GA4) landing page report.

Change can be difficult. What steps are you taking to get ahead of the curve?

While this post is not an ultimate guide to Google Analytics, I’ll show you how to get GA4 set up and give you the best GA4 tips out there. From setting yourself up to best practices, by the time you’re finished, you’ll feel confident creating a landing page report in GA4.

What Is GA4?

Google Analytics 4 is the latest edition of one of the greatest web analytics tools on the market.

With so many awesome features and a smooth user interface, it’s no wonder that over 28 million websites worldwide count on Google Analytics to track their traffic.

With a landing page report in GA4, you can follow the digital path your customers travel along your branded content.

The best part? GA4 landing page reports track customer data from all the platforms your content is on to determine trends in traffic, engagement, product demand, predictions, and more.

It accomplishes these incredible analytic feats with the help of artificial intelligence. With the use of AI, GA4 helps you figure out how customers are currently using your content, as well as predict what customers will do next.

You don’t have to be a large business to make GA4 work for you. In fact, a recent survey by Enlyft found that roughly 71% of businesses that use Google Analytics are small companies with less than 50 employees.

While this may all sound similar to what you’re used to in Universal Analytics, the two function quite differently.

The biggest difference between UA and GA4 is the way data is collected and organized. While the former groups user interactions into time-blocked “sessions,” GA4 tracks each and every user interaction as its own event.

What does this mean? Well, because of this key switch, GA4 is better at predicting the behavior of customers in a wider variety of ways.

What Is A Landing Page Report in GA4?

Simply put, a GA4 landing page report is a detailed analysis of user interactions based on metrics that you choose.

For those who don’t know, a landing page is the page that is a user’s first interaction with your website or platform. For example, if you searched for information about landing page reports and clicked on the link for this article, then this page is your landing page for my site.

A landing page report in GA4 gives you deeper analytic tools that can really help you develop the best SEO strategy.

Neil Patel talking about advanced SEO tactics.

If you’re familiar with UA, you’ll remember that their landing page report was automatically generated. All you had to do was look for the report by clicking the Behavior drop-down menu. and from there. clicking Site Content and then Landing Pages.

GA4 is not automatic. Fortunately, it only takes a few steps to get your GA4 set-up.

Creating Your Landing Page Report In GA4

GA4 landing page reports must be generated manually. The good news is you can create your own preset landing page report, so you don’t have to set it all up each time you need information.

Follow these steps to create your own landing page report in GA4.

Get Started

Log in to your account with GA4. From there, open your Reports (the button below the Home icon, with a bar graph inside a white square). Next, click on Acquisition and then look for and select Traffic Acquisition in the dropdown menu.

The traffic acquisition page on GA$.

Pull a Report

In case you don’t already know, dimensions are essentially the qualitative titles or categories being measured by GA4. When you choose Traffic Acquisition, GA4 will pull a report for you, automatically using the Session default channel grouping dimension.

While this is great info for you to know in order to increase traffic to your website, it’s not the data on user landing page interactions.

Customize Your Report

To create a custom landing page in GA4 to suit your analytical needs, click on the small pencil icon in the upper right corner of the user window.

Customizing the channel group on the traffic acquisition page on GA4.

In addition to adding new dimensions, the Customize Report button can add new metrics, rework charts and create summary cards.

For our purposes, we’ll focus for now on the dimension aspect.

Add a New Dimension

On the right side of the screen, click on Dimensions and then select Add dimension.

From there, you should be able to scroll through the options until you find one labeled Landing Page. Click it, and landing pages will be added to your primary dimensions.

Don’t forget to save when you’re done!

Set as Default

Let’s get real: do you actually want to go through those steps every time you want to analyze user interaction on landing pages?

No way! Follow this quick GA4 tip to make a shortcut for yourself.

Locate the Landing Page dimension once more. This time click on the three vertical dots and then select Set as Default.

When you are finished, click the Apply button in the lower right corner to save your new default setting.

If your goal is to replicate the UA report as close as possible, you will need to follow a few more steps.

Customize Metrics

Not all engagement metrics are created equal. As you become more familiar with the GA4 set-up, explore all the data at your fingertips to determine which data will help the most. You never know what new insights you’ll discover!

Customizing metrics is not all that different from dimension customization.

Instead of clicking on Dimensions, this time select Metrics.

From here, you can add and remove metrics that suit your needs. For a UA-style landing page report, make sure to choose the following metrics:

  • Sessions
  • New Users
  • Engagement Rate
  • Average Engagement Time
  • Event Count
  • Conversions
Customizing the metrics of the landing page report in GA4.

Create a New Summary Card

Summary cards are a great way to take a fast scan of your analytics when checking reports.

While they won’t show you everything, summary cards can help you streamline your review of the information you find most important.

To create a new summary card, simply click on Create a New Card. From there, you can customize the card to choose specific dimensions, metrics, and visualization style.

Save Your New Template

The key here is not to overwrite your other template that you used to get started. Instead, save your work as a New Report.

Make a Shortcut to Your Report

Remember, our intention is to make pulling GA4 landing page reports as quick and easy as possible.

That’s why I would recommend creating a shortcut for you to access this with just a couple of clicks going forward.

  • First, click on Reports.
  • Next, click on Library. There should be a folder icon next to the word.
  • Unless you’ve already created some collections, you should only see two collections. In the collection marked Life Cycle, click where it says Edit Collection.
  • A prompt on the left will ask you to drag reports to create collection. Find your report template and drag it into the topic labeled Acquisition.
Making a shortcut in the collections screen on GA4.

That’s it!

Now when you click on the Reports icon on the main menu, you can pull your latest landing page report with ease. Simply click the drop-down menus for Life Cycle and Acquisition, where you will find the template that we’ve been putting together.

Best Practices For Landing Page Reporting

The whole point of this practice is to understand what customers are driven towards and how we can improve our content to bring in more traffic.

When you run your GA4 landing page report, be on the lookout for pages that have a low number of visits, or worse, poor engagement. These are areas of growth for your brand.

Take advantage of landing pages that are doing well. Any time a landing page has a high click rate and engagement, you should be looking for ways to capitalize on that momentum.

Add more links to that page that direct users to more of your articles. Use those pages to advertise upcoming promotions. If at all possible, recreate that style of writing in new content.

Conclusion

Google Analytics 4 is a powerhouse of reporting. In the right hands, GA4 can revolutionize your marketing and content strategies.

Don’t wait until UA finally kicks the bucket for good in 2023. Learn about GA4 now to easily generate the reports that matter most. You should consider creating your GA4 tracking ASAP so you have as much data as possible to compare for reporting.

We’re also here to help!

If you need more information on how to best utilize the features of your GA4 landing page report, or if something doesn’t look right, just reach out and my team will get back to you ASAP.

How are you going to use Google Analytics to increase your web traffic? Let me know!


from Neil Patel https://ift.tt/hAKousJ
via IFTTT

Friday 28 October 2022

SEO Web Hosting Guide: 7 Things To Look Out For

From keywords to building backlinks and analyzing your competitors, there are many things you can work on to increase your website ranking. However, there might be one area you’re overlooking. Any idea what I’m talking about yet?

It’s the influence your web hosting has on SEO.

Whether you realize it or not, the web host you choose can make all the difference between getting your website ranking higher or being pretty much invisible online.

When you think about it, it’s obvious why.

The web host you go with impacts several areas of your website, including uptime and loading speeds.

If you are researching how to host a website, here are 7 things to look out for to help meet your SEO needs.

Why Web Hosting Is So Important For SEO

Your chosen web host plays a significant role in putting your website on the map and keeping it visible, and therefore, you need to pick your web host carefully.

Before I go too much further, let’s just see what Google says about how search works. It considers five factors:

  • Relevance
  • Meaning
  • Quality
  • Usability
  • Context

As we’re talking about SEO and web hosting, I’ll focus on usability. For ranking, Google looks at:

  • Loading times
  • Mobile friendliness
  • Country and location (so Google can serve location-based content)

Basically, the more accessible your content is, the more likely it is to rank better.

Google also considers page experience signals, like whether your site uses HTTPS.

Your webhost influences all of the above, which is why you need to choose carefully.

What To Look For When It Comes To Web Hosting And SEO

When it comes to web hosting and SEO, you should expect a few things from your provider as standard, such as uptime reliability and efficient loading times. However, as detailed in the next section, there are other features to look out for:

1. Uptime Reliability

For businesses, a few minutes of downtime can cost thousands of dollars in lost productivity. For your visitors, it’s frustrating if they can’t access your website or if it keeps crashing. However, downtime is equally damaging to your reputation among search engines.

The likes of Google regularly visit websites, and if your website is down a lot, your site gains a reputation for unreliability.

While no web host can guarantee to keep your site online 100 percent of the time, most hosts now provide 99.9 percent uptime. According to Search Engine Journal, 99 percent uptime equals approximately 1.44 minutes of downtime daily, or 8.8 hours a year. Pretty good, huh?

2. Speed

Ever heard the saying ‘speed is of the essence’? Your visitors agree with this, which is why you don’t want to keep them hanging around.

A slow website causes users to leave, increasing your bounce rate significantly, as the stat from Google’s research shows.

A statistic about the probability of a bounce in Google.

However, despite the importance of fast loading times, too many websites fail to make the grade.

According to research by Littledata, the average time it takes for a mobile page fully loads is 4.6 seconds. On the face of it, that sound pretty swift, but it won’t put you among the best-performing sites.

What should you be aiming for?

Littledata says if you want your site among the top twenty percent, then your loading time should be within 3.2 seconds. To appear in the top ten percent, your site should reach a full mobile page load within 2.6 seconds.

Not sure about your current speed? Here are some tools to check:

  • Pagespeed Insights
  • Uptrends
  • Pingdom
  • GTMetrix

That’s your speed covered, now let’s move on to the importance of customer service.

3. Customer Service

When choosing web hosting for SEO, there are some key areas of customer service to think about:

  • The size of the company. Although it’s not always the case, a larger company is more likely to have better resources and staff available to help with customer service issues. They also have more money to invest in training their representatives.
  • The company’s overall reputation. These days, you don’t need to look too far to view other people’s opinions. Find out what others say by looking at web hosting service reviews and use that as guidance for narrowing down your choices.
  • Availability: is the company available 24 hours a day and seven days a week? Problems with hosting can occur at any time. You need to know that someone is available to take your call.
  • Contact options: The easier it is to get in touch with a company, the better. Email and contact forms are great, but it can take time to get responses. Look for companies with a customer service contact number, social media accounts, and Live Chat for quicker responses.

4. Security

Would you buy from a site you don’t trust? I doubt it. It’s also unlikely that you’d share your sensitive information if the site didn’t have an HTTPS certificate, but It’s not just about consumer trust.

Back in 2014, Google first named HTTPS as a ranking factor. As Google’s Search Advocate, John Mu, explains on Twitter, it’s only a lightweight ranking factor, and the lack of an HTTPS won’t stop your site from getting indexed.

However, as Mu explains, HTTPS is great for users, and Google’s research shows a considerable rise in web users relying on HTTPS. Here are some of the key stats:

  • Desktop users load over half of the pages they view via HTTPS and spend two-thirds of their time on secure pages
  • 98 percent of Chrome users load pages via HTTP
  • While HTTPS is less common among mobile users, figures among these visitors are growing too

While you can install an SSL certificate yourself, the easiest way is to find a web host that provides a free or affordable certificate.

Some of the sites offering free SSL certificates include

  • Hostinger
  • Hostgator
  • Siteground
  • A2 Hosting

That’s HTTPS covered. What about server location and its impact on your SEO and web hosting?

5. Server Location

Does server location affect loading times? Absolutely.

In a YouTube clip, former Google Search Quality expert Matt Cutts said: ‘We try to return the most relevant results to each user in each country. And server location in terms of IP address is a factor in that’.

For example, if your server is in the United States, but most of your customers are in the United Kingdom, data transfer times are likely to be considerably delayed. However, changing the server location to the UK is likely to reduce response times and improve website loading speed.

The reason for this? Well, it comes down to two things: network latency or ‘ping’ (the time it takes for information to travel from one point in a network to another) and time to the first byte (the interval between the request being sent to the server and the browser receiving the first byte).

The server location also affects your bounce rate and legal compliance (you need to store any data per local laws)

To help find the best server locations for your site, follow these three tips:

  1. Go to Google Analytics and sign in. Next, choose ‘audience’, then ‘geo’, and ‘location’ to determine where your audience is based.
  2. Check latency times. You can use a free tool like the one at devicetests.com:
The ping test in Google Analytics.

3. Check your Time For First Byte with a tool such as GeekFlare:

Checking Time For First Byte with Geekflare.

For both tests, the lower the number, the better.

If you notice delays, it may be worth looking around for the best cheap web hosting and transferring your website to another provider.

6. Shared Hosting

Shared hosting is a popular option for small businesses, as it offers an affordable way to start a website, but it has some downsides.

The biggest issue for users can be website performance. As shared hosts typically have many users sharing the same server, performance can suffer compared to dedicated servers. This can result in slower page load times and decreased Site Speed Index scores (a page loading score metric).

Further, if you need to make any major changes or updates to your website, like adding new features or redesigning your entire site, then the customization options may be limited.

You may also find that your performance dips the more your traffic grows.

That said, shared hosting has plenty of positives, such as its ease of use and scalability,

7. CMS Quality

A content management system (CMS) is a software application or set of related programs used to create and manage digital content efficiently.

It aids your web hosting SEO by enabling content optimization and its integrated SEO plug-ins.

According to Zippia, there are over 80 CMS options to choose from, and 64.9 percent opt for WordPress.

The majority of CMS users use WordPress.

The sheer number of available systems can make it difficult to choose, so look for the following three features to narrow down your options:

1. Ease of use: A CMS should be easy to use, even for beginners, and have a user-friendly interface and simple, straightforward controls.

2. Flexibility: Find a flexible CMS to accommodate your website’s specific needs. It should allow you to add or remove content easily, change layouts, and more.

3. Compatibility: Ensure the CMS is compatible with popular web browsers and devices. It should also work well with other software and plugins you may want to use

FAQs

Does Web Hosting Include SEO?

It depends on which host you’re using. If SEO isn’t already built-in, you can often add plug-ins to your CMS for optimization

Is Free Hosting Good for SEO? 

It depends on the host. Some are better than others but remember, you get what you pay for, and web hosting costs shouldn’t be your only consideration. Free hosting sites may lack quality, advanced features, and built-in SEO.

Does Server Location Affect SEO?

Yes. The closer the server location is to your visitors, the quicker the speed.

Is Wix Good for SEO?

Wix has some great SEO features, including a Google Search and Google Analytics integration, as well as a single template for SEO on multiple pages. 
Additionally, Wix has an SEO Wiz. This is a step-by-step checklist that you’ll find on your site’s dashboard under ‘marketing home’. The checklist helps you to connect and verify your site with Google, enables efficient site indexing, and gives you SEO tips for improved visibility.

What are Examples of Web Hosting With Effective SEO Web Hosting Tools?

Hostinger, Bluehost, and SiteGround all score well among reviewers for SEO web hosting, but it all depends on what features you’re looking for.

Conclusion

You will most likely have a long-term relationship with the hosting service you choose, so you want to pick the right one.

With so many web hosts to choose from, finding the perfect host is often time consuming, and you might not always get it right the first time.

To simplify things, when looking for a provider for your SEO web hosting, ensure it offers uptime reliability, speed, and security.

Also, don’t overlook server location and the impact it can have on your SEO, and test customer service first by making a few queries.

What tips do you have for SEO and web hosting?


from Neil Patel https://ift.tt/qIOtmsB
via IFTTT